Time series plot with mean and standard deviation
A time series plot of numerical data with rolling mean and standard deviation. Numerical data in y_value column of the SQLite table defined by table_name is used to plot this graph.
SQLite table must have; Run, Sample, Date, y_value columns to generate the plot.
In case of per_sample graph Run column is not required.
For per_sample graph if only Run column is present in the table, Run column is used to generate plots.
Example Plot
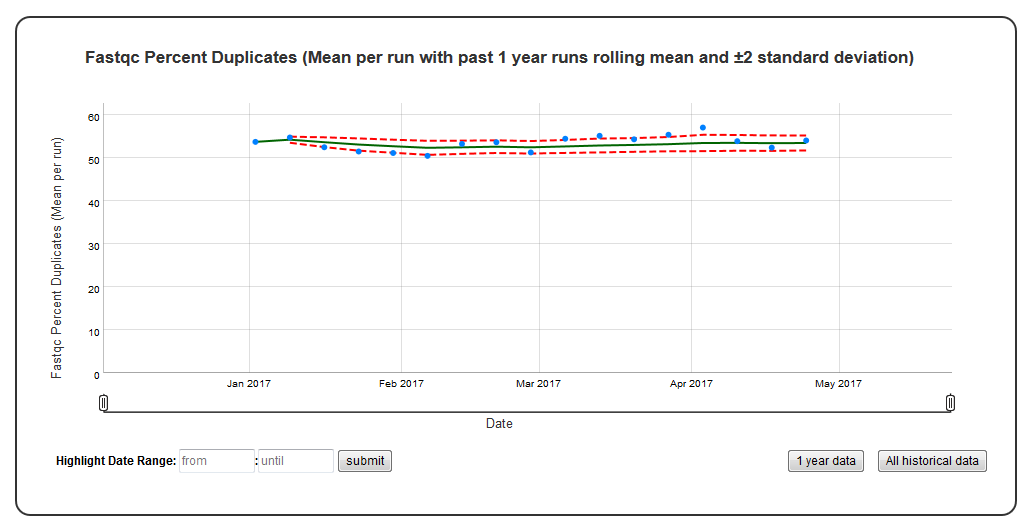
Chart Properties
| Option | Type | Use |
|---|---|---|
| Chart_title | String (Optional) | This is used to create the title of the chart. Default is “{y_label} (Mean per run with {window} rolling mean and ± standard deviation)”. E.g. “Fastqc Percent Duplicates (Mean per run with past 1 year runs rolling mean and ±2 standard deviation)”. |
| y_value | String (Required) | Column header in SQLite table. The column should contain numerical data. This data is plotted on the y-axis. E.g. “FastQC_percent_duplicates”. |
| y_label | String (Optional) | This is used to create the y-axis label in the chart. Default is “Mean {y_value} per run”. E.g. “FastQC Percent Duplicates”. |
| window | Integer or String (Optional) | Window can be an integer (n) or number of days in the format “365D” (d). If an integer (n) is is specified, rolling mean and standard deviation is computed based on past “n” runs. If number of days (d) is specified, rolling mean and standard deviation is computed based on runs in the past “d”. E.g. 1. window=”10”, this will compute rolling mean and standard deviation based on past 10 runs. 2. window=”365D”, this will compute rolling mean and standard deviation on the runs in past 365 days. Default is “365D”. |
| per_sample | Boolean (Optional) | Plot per sample graph. Default is “False”. If set to “True” per sample graph will be plotted. |
Example JSON entry (minimum):
[
 {
  "chart_type": "time_series_with_mean_and_stdev",
  "chart_properties": {
      "y_value": "FastQC_percent_duplicates"
      }
 },
]
Example JSON entry (full) to plot all samples excluding HCT15 and NTC:
[
{
"table_name": "Production_Run_Stats_Summary",
"include_samples": "all",
"exclude_samples": "HCT15, NTC",
"chart_type": "time_series_with_mean_and_stdev",
"chart_properties": {
"chart_title": "Fastqc Percent Duplicates (Mean per run with past 1 year runs rolling mean and ± standard deviation)",
"y_value": "FastQC_percent_duplicates",
"y_label": "FastQC Percent Duplicates",
"window" : "10",
"per_sample": "False"
}
}
]